Three words that came from physics
This one comes from AG1 Derek Conklin, USN. He noticed that a field about language keeps reaching for the vocabulary of heat, and asked whether the resemblance means anything. It does, and more than I expected when I first went looking. In three places this field picked up an equation from thermodynamics and information theory and used it unchanged: the same equation, not a family resemblance. There are also two or three places where the borrowing gets pushed further than it can carry, and I am as specific about those as about the rest. Everything below is arithmetic you can check on a phone.
Three of the commonest words in this field were borrowed from somewhere else. The number a language model is trained to make small is called cross-entropy. The knob that sets how adventurous its writing is, is called temperature. The machines that make pictures are called diffusion models. That is a thermodynamics textbook's table of contents, and none of it was chosen for flavor.
Coincidence, marketing, or one idea in three hats? One idea. In each place the equations are the ones physics already used, borrowed by people who knew what they were borrowing. The last section says where the borrowing stops, because that is where the claim earns its keep.
Surprise: counting coin flips of not-knowing
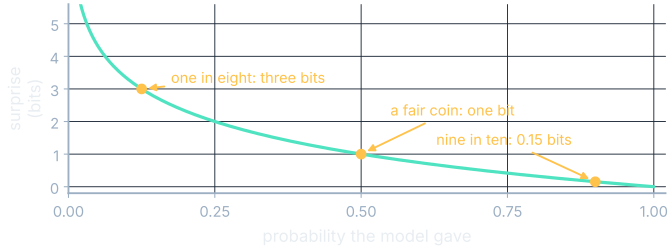
Before a fair coin is flipped, the amount you do not know is exactly one flip's worth. Call that one bit. Three coins, eight outcomes, $\log_2 8 = 3$: three bits. Now make the coin unfair. If something was going to happen nine times in ten and it does, you learned almost nothing; if a one-in-eight event comes up, you learned a lot. So the amount learned should grow as the probability shrinks, and be zero at certainty. One formula does that:
$$s = -\log_2 p$$In words: the surprise of an outcome, in bits, is minus the log base two of the probability that outcome was given. Certainty gives zero; the rarer the outcome, the larger the number.
Three surprises, by hand
A fair coin, $p = 0.5$: two equally likely outcomes, $\log_2 2 = 1$, so $1$ bit. A one-in-eight event, $p = 0.125$: eight outcomes, $\log_2 8 = 3$, so $3$ bits. A nine-in-ten event, $p = 0.9$: nine tenths is close to one, so the surprise is close to zero: $0.15$ bits.
In words: rare things carry a lot of information when they happen, near-certain things almost none, and the exchange rate between "how likely" and "how much" is a logarithm.
Entropy: the average surprise
Surprise is about one outcome after it happens. Entropy is about the whole die beforehand: take each outcome's surprise, weight it by how often that outcome occurs, add the pieces up.
$$H = -\sum_i p_i \log_2 p_i$$In words: for each outcome i, multiply that outcome's probability by its own surprise, and add the results. That is all the sum sign asks for. The letter H is the standard name for this quantity, measured in bits.
A fair coin has entropy $0.5 \times 1 + 0.5 \times 1 = 1$ bit; four equal faces give $2$ bits; a coin loaded nine-to-one falls to $0.9 \times 0.152 + 0.1 \times 3.322 = 0.469$ bits, because you mostly know already. Now the die from the last question: a pretend vocabulary of three tokens, the context "The cat sat on the", and shares of $0.705$ for mat, $0.259$ for floor, $0.035$ for dragon.
The entropy of the mat/floor/dragon die
Each token's surprise first: $-\log_2 0.705 = 0.504$ bits, $-\log_2 0.259 = 1.949$ bits, $-\log_2 0.035 = 4.836$ bits. The rare word is the expensive one. Weight each surprise by how often it is paid, and add:
$$H = 0.705(0.504) + 0.259(1.949) + 0.035(4.836) = 0.355 + 0.505 + 0.169 = 1.03$$In words: about one bit. Before the model rolls you are one coin flip short of knowing which word comes out, even with three on offer, because one of the three carries most of the weight.
Read that two ways. Entropy is the average number of yes-or-no questions needed to pin the answer down, and one question, "is it mat?", settles it seven times in ten. It is also perplexity in disguise: $2^H = 2^{1.03} = 2.04$ equally likely options would leave you exactly this much in the dark.
Entropy is therefore a spread-meter for any prediction. "The capital of France is" puts about $0.98$ on Paris and comes to $0.16$ bits; "My favorite color is" spreads across five plausible words and comes to $2.23$ bits. That is fourteen times the uncertainty from the same machine at the same step, and it measures the language rather than the model.
Shannon measured this for English in 1951 with no computer. He hid the next letter of a passage and had people guess it, over and over. From the tallies he put the entropy of printed English between $0.6$ and $1.3$ bits per letter, given a hundred letters of context. A language model is that experiment at scale, with the guesser replaced by the die.
Cross-entropy: the price of the wrong die
Entropy is what the world costs. The useful question is what you pay for being wrong about it. Write the true shares as $p$ and the model's as $q$: outcomes still arrive at the true rates, but every surprise is billed at the model's price.
$$H(p, q) = -\sum_i p_i \log_2 q_i$$In words: the world's rates times the model's surprises. This is cross-entropy, the exact quantity every language model is trained to make small.
Paying for a bad opinion
Let the truth be a fair coin, $p = (0.5, 0.5)$, while the model is sure it is loaded: $q = (0.9, 0.1)$. Heads still comes up half the time, but the model prices heads at $0.152$ bits and tails at $3.322$ bits.
$$H(p,q) = 0.5(0.152) + 0.5(3.322) = 0.076 + 1.661 = 1.737$$In words: the wrong die costs $1.737$ bits per flip against a true entropy of $1$ bit, and the extra $0.737$ bits is pure penalty for being wrong, charged on every flip forever.
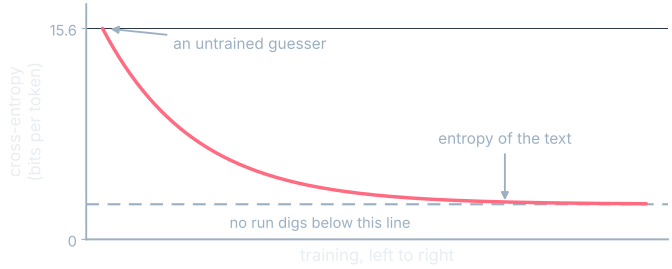
That gap is the KL (Kullback–Leibler) divergence: never negative, zero only on an exact match. So cross-entropy always splits in two: the entropy of the thing being predicted, which nobody can touch, plus the divergence, which is the only part training can reduce. A training curve is a divergence running out, and the floor it lands on is the entropy of the text.
Prediction is compression
Here the link stops being suggestive and becomes an identity. Shannon's 1948 paper proved that if you know each symbol's probability you can build a code spending $-\log_2 p$ bits on a symbol of probability $p$, and that no code does better on average. Common things get short codes, rare things long ones, and the average length is the entropy. Real encoders reach that bound to within two bits for the whole message, however long. Arithmetic coding writes the whole message as one number in a shrinking interval, narrowing it by each symbol's share in turn, so a share of $p$ costs $-\log_2 p$ bits of precision.
Five symbols, three price lists
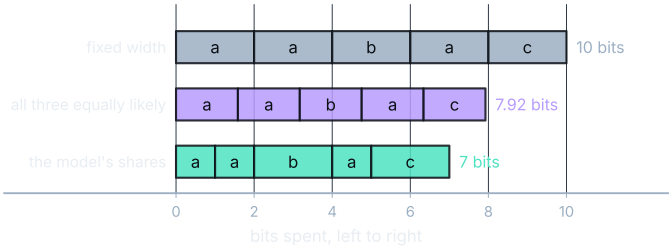
An alphabet of three letters with shares $p(a) = 0.5$, $p(b) = 0.25$, $p(c) = 0.25$, and the message a a b a c. Priced with those shares, each a costs $1$ bit and each b or c costs $2$: total $1 + 1 + 2 + 1 + 2 = 7$ bits. Priced as though all three were equally likely, each costs $\log_2 3 = 1.585$ bits: $5 \times 1.585 = 7.92$ bits. Priced at a fixed two bits per letter: $10$ bits.
In words: the same five letters cost ten bits, or about eight, or seven, depending on how well the code's beliefs match the letters' real rates. Knowing the shares better is the whole saving.
Put the halves together. A model's loss on a document is the sum over tokens of $-\log_2 q$ on the token that actually came next; a coder driven by that model spends $-\log_2 q$ bits on that token. Same number. The training loss over a document, converted to bits, is that document's compressed size. Better prediction is better compression, and the best predictor is the best compressor. Delétang and colleagues ran that experiment in 2023. Used as a plain lossless compressor, a seventy-billion-parameter language model squeezed image patches to $43.4$ percent of raw size where PNG managed $58.5$, and audio to $16.4$ percent where FLAC managed $30.3$. That was data it had never been trained on.
Temperature is Boltzmann's
The second borrowing is an equation you could have found in a physics book a century before anyone trained a network. Take a system that can sit in various states, each with its own energy, held at some temperature. Statistical physics says how likely each state is, and the rule is easier in words than in symbols: a state's chance falls off exponentially as its energy rises. Each fixed step up in energy divides the chance by the same factor, and the temperature sets how big that factor is. Cold means the system sits in its lowest-energy state; hot means it wanders among all of them.
$$p_i \propto e^{-E_i / (k T)}$$In words: the chance of a state is proportional to e, the number about $2.718$ that softmax raised to each score in the first question, raised to minus that state's energy divided by the temperature. The open-loop sign $\propto$ means "in step with, up to one shared scaling factor". The letter k is Boltzmann's constant, converting temperature into energy units, and the shared factor is whatever makes the chances add to one.
Compare softmax, the step that turns raw scores into shares: a token's chance is proportional to $e^{z/T}$, with $z$ the score and $T$ the temperature setting. Read the score as negative energy, so that a high-scoring token is a low-energy state, fold $k$ into the units, and the two expressions are character for character the same. Softmax is the Boltzmann distribution, applied to tokens instead of states. The expression transfers, and everything that follows from its shape. The physics behind it does not, and the last section says which parts those are. Jaynes supplied the fact that makes this more than an accident of algebra: in 1957 he showed this distribution has the largest entropy of any with a given average energy. Softmax is the least committed die consistent with how well the model expects to score, smuggling in nothing beyond the scores.
Heating the die
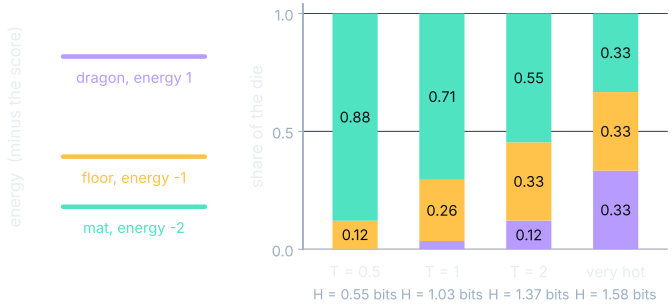
The same three scores ($2$ for mat, $1$ for floor, $-1$ for dragon) at four temperatures; dividing every score by $T$ before exponentiating is the only change. At $T = 0.5$ the scores become $4, 2, -2$, the shares $0.879, 0.119, 0.002$, entropy $0.55$ bits. At $T = 1$, the familiar $0.705, 0.259, 0.035$, entropy $1.03$ bits. At $T = 2$ they flatten to $0.547, 0.331, 0.122$, entropy $1.37$ bits. Let $T$ run to infinity and every score divides away, leaving three equal thirds and $\log_2 3 = 1.58$ bits, the most a three-sided die can hold.
In words: entropy climbs with temperature, from $0$ at the cold end through $0.55$, $1.03$ and $1.37$ to a ceiling of $1.58$. At $T = 0$ the whole share goes to the top-scoring token: the system sits in its ground state, the lowest-energy one, and stays there.
Diffusion is diffusion
The third borrowing is the most literal, and one object needs naming first. A Gaussian, the bell curve, takes two numbers: where it is centered, and how wide. The width is the spread, written $\sigma$ and said "sigma", and the spread multiplied by itself is the variance.
The forward process built rung by rung in Destroying an Apple does one thing per step: shrink the picture slightly toward zero, then add a little Gaussian noise to every pixel. Repeat a thousand times and no apple is left, only the bell curve. Track the spread of possibilities rather than any one picture, the density defined in the next paragraph, and in the continuous limit that density obeys the diffusion equation, the same one that describes heat spreading through a bar of metal. One extra term from the shrinking keeps it pulling gently toward the center. The borrowing was deliberate: the 2015 paper that opened this line of work is titled Deep Unsupervised Learning using Nonequilibrium Thermodynamics, and the 2020 paper that made it work at scale builds straight on it.
What rises as it runs is entropy, and measuring that needs one adjustment. A pixel's value is continuous, so instead of a probability per outcome there is a probability density, a curve whose area over a stretch gives the chance of landing there. Entropy still works, with the sum replaced by an area, and for a Gaussian it has a closed form:
$$h = \tfrac{1}{2}\log_2(2\pi e\,\sigma^2)$$In words: a bell curve's entropy depends only on its width. A spread of $0.1$ gives $-1.28$ bits, $0.5$ gives $1.05$ bits, $1$ gives $2.05$ bits. That $-1.28$ is not a mistake: continuous entropy is measured against a unit of width rather than a count of outcomes, so anything narrower than that unit comes out below zero. The climb that follows holds for any starting density narrower than that unit bell curve, which every normalized picture is.
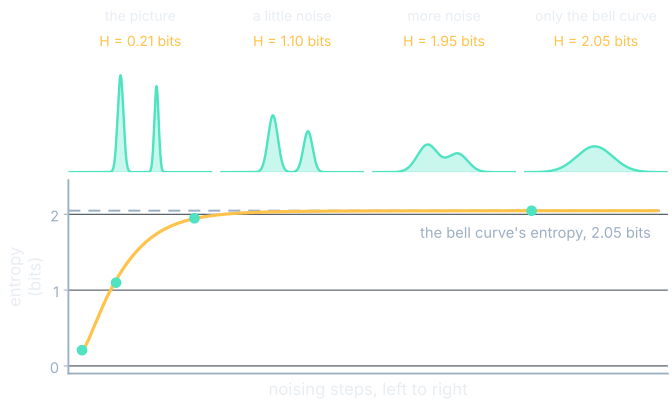
So the forward process destroys information, and the rising entropy curve measures how much. The model's job is to run that film backward, which raises the objection everyone raises: the second law of thermodynamics says entropy does not go down. But the second law governs a closed system, and this one is wide open. Undoing the spreading is paid for twice. In information, by a trained network that has learned the score, meaning which direction from here leads toward likelier pictures. And in energy, as electricity into a data center. A refrigerator chills one region without troubling the second law for the same reason: it is plugged in. The sampler that uses the score has a physics name too: Langevin dynamics, written down for a particle jostled by its surroundings:
$$x \leftarrow x + \epsilon \nabla \log p + \sqrt{2\epsilon}\, \cdot \text{noise}$$In words: take the current point, step a small distance $\epsilon$ (epsilon, the step size) in the uphill direction of the log of the density, then add a small random kick. The upside-down triangle is the gradient, the same uphill arrow Slopes and Descent uses in training, pointing here toward likelier pictures rather than lower loss. It is a ball rolling downhill in a landscape whose height is minus the log of the density, so downhill there is uphill in probability, nudged each step so it never settles in the first dent it finds.
Free energy, and the heat is real
This first connection is a theorem. Diffusion models are trained on a bound rather than on the entropy climb itself. A bound is a quantity guaranteed to sit above the thing you care about, so pushing it down drags the real quantity with it. People call it the evidence lower bound, or ELBO. Write that bound out and it is, term for term, the variational free energy of statistical physics: an energy term minus a temperature times an entropy term. It is the same expression, which is the only sense in which any of this chapter’s three claims is meant. The 2015 paper derived it from exactly that literature, and the 2020 paper that produced the first convincing images trains a simplified form of the same bound.
The second is also a theorem, and smaller than it sounds. Landauer showed in 1961 that erasing one bit in any physical device must release at least $kT\ln 2$ of heat: k times the temperature times the natural log of two, the same natural log the nats note met earlier. At room temperature that is about $2.9 \times 10^{-21}$ joules. Information and thermodynamics are joined by a hard physical floor, and that is a genuine result.
This third part is interpretation. It is tempting to conclude that the heat pouring off a training run is Landauer's heat, the physical price of squeezing uncertainty out of a corpus. It is not. A real processor spends about a billion times Landauer's limit per operation. The heat is real and the bill is real, and what you are paying for is engineering: moving charge around on silicon, well above the minimum thermodynamic price of the information.
Where the borrowing stops
Everything above is a real correspondence, and a chapter that stopped here would leave you better equipped to be wrong.
There is no conserved energy in a language model. Physics gets its temperature from a system that conserves energy and trades it with its surroundings; that is what makes a thermodynamic temperature measurable. A network has scores. Calling minus the score an energy is a relabeling that makes one equation match, and it buys nothing else: no conservation law, no heat flow, no equilibrium between two models placed in contact.
You set the temperature; nothing measures it. You set $T$ in a configuration file. Nothing inside the model has a temperature you could go and measure, and no thermometer is available to disagree with you.
The die is over tokens, not over physical states. Boltzmann's distribution describes arrangements of matter; softmax describes which word comes next. The equation is shared, the objects it ranges over have nothing in common, and no result that depends on the physics (pressure, heat flow, equilibrium) transfers to text on the strength of a shared formula.
This chapter used the word entropy for two different things. The entropy of the model's die at one position, $1.03$ bits for mat, floor and dragon, is a property of a single prediction, and the temperature knob moves it. The entropy of the text is a property of the language, the floor under the loss curve, and no knob shifts it at all. Keeping those apart is most of what it takes to reason about this correctly. The differential entropy of the diffusion section is a third thing again: it can go negative and it depends on the units of the axis, which the bit counts cannot.
None of this says a model is warm, alive, or a gas. Three groups of people reached for the same equations at different times and for different reasons, and each time the equations fit.
The video below assembles the whole argument from the coin up.
What you now know
- Surprise is $-\log_2 p$, in fair-coin flips of not-knowing, and entropy is its average over a distribution: $1.03$ bits for the mat, floor and dragon die, about two equally likely choices.
- Cross-entropy is what the wrong beliefs cost, and it splits into the entropy of the thing predicted plus the KL divergence, the only part training can reduce.
- A document's training loss, in bits, is that document's compressed size. Better prediction is better compression, and the entropy of the text is a floor no run digs below.
- Softmax with temperature is Boltzmann's distribution with the score read as negative energy, and the die's entropy climbs with temperature as a physical system's does: $0$, then $0.55$, $1.03$, $1.37$, to a ceiling of $1.58$ bits.
- An image model's forward process is the diffusion equation, its entropy climbs measurably to the bell curve's $2.05$ bits, and running it backward is paid for with a trained network and with electricity, which is why the second law is untroubled.
- The borrowing stops at conserved energy, at measurable temperature, and at the gap between a model's die and the text: the equations transfer, the physics does not.
Where we're headed
The first question ended with a die that training had loaded and a product had trimmed. This one says what the loading cost and what it bought: every step of training buys down the price of the next token, in bits, against a floor set by the language rather than the machine. For the same story in nats with the loss curve up close, read Measuring Wrongness; for where the shares came from, The Prediction Game. And to watch entropy run backward for eight chapters, How AI Makes Images is the whole book, opening with an apple destroyed on purpose.