The page has been lying to you
Every picture so far has been drawn flat, on a page, because a page is something you can check with a pencil. That was the right way to start. It is also the reason most people who use these tools carry an intuition that quietly fails them, because a real model does not work in two dimensions. It works in 384, or 1024, or 4096.
The usual reassurance is that high dimensions are "just more of the same" — same arithmetic, more slots. The arithmetic part is true and we proved it in Chapter 1. The geometry part is not true at all. Space in many dimensions behaves in ways that have no flat-page analogue, and the differences are not curiosities. They are the reason embeddings work.
This chapter is an experiment, run four times. We are going to draw two arrows at random, measure the angle between them, and do that twenty thousand times — first on a page, then in 10 dimensions, then 100, then 1000. Watch what the answer does.
The experiment: twenty thousand random pairs
Here is the whole procedure, and it is short enough to hold in your head. Pick a direction at random — every heading equally likely. Pick a second one the same way, with no reference to the first. Measure the angle between them. Write it down. Repeat.
On a page, with only two dimensions to play in, you already know roughly what to expect. The second arrow can land anywhere on the circle, so the angle between them is a coin toss across the whole range: sometimes nearly aligned, sometimes nearly opposite, sometimes square. No angle is favored, and the first panel below shows exactly that — a flat histogram, every angle about equally common.
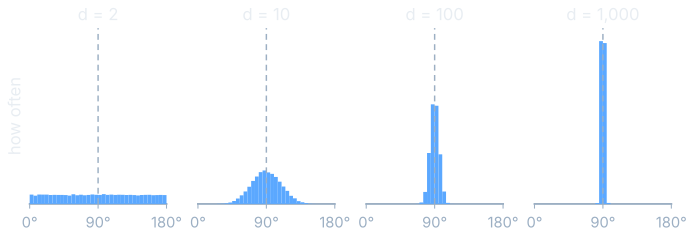
The measured numbers are worth reading slowly, because they are stranger than the picture lets on.
| Dimensions $d$ | Average angle | Spread (one standard deviation) | Share within 10° of a right angle |
|---|---|---|---|
| 2 | 89.8° | 51.9° | 11.5% |
| 10 | 90.0° | 19.2° | 39.0% |
| 100 | 89.9° | 5.8° | 91.6% |
| 1000 | 90.0° | 1.8° | 100.0% |
The average never moves. It sits on a right angle at every dimension count, which is the unremarkable half of the result — of course a random direction is as likely to lean one way as the other. The remarkable half is the spread. At $d = 1000$, every single one of twenty thousand pairs landed within ten degrees of square. Not most of them: 20,000 out of 20,000, and the worst pair in the whole run was 7.7 degrees off.
Two directions at right angles are called orthogonal, and their dot product is exactly zero — they agree about nothing. So the finding, in one sentence: in a space with many dimensions, two things chosen without reference to each other are almost always almost unrelated, and the more dimensions there are the more reliably this is true. This behavior has a name, concentration of measure, and it is the governing fact of the spaces models live in.
Why the votes cancel
The mechanism is easier than the result. Look again at what a dot product between two unit arrows actually does: it walks down both lists, multiplies each pair of matching entries, and adds up $d$ separate contributions.
Each of those contributions is a small number that is as likely to come out positive as negative, because neither arrow knows anything about the other. So we are adding up $d$ random votes, half of them for and half against. With two votes, one side can easily win outright, and every margin is as likely as every other — that is the flat first panel. With a thousand votes drawn the same way, the chance that they fail to mostly cancel is vanishingly small.
They do not cancel perfectly. The leftover wobble shrinks as the square root of the number of votes, which gives us a rule we can check against the table above:
$$\text{spread of } \cos\theta \approx \frac{1}{\sqrt{d}}$$In words: the typical size of the alignment score between two unrelated directions is about 1 divided by the square root of the number of dimensions. Quadruple the dimensions and the wobble halves.
Checking the rule against the measurements
At $d = 100$ the rule predicts a spread of $1 \div \sqrt{100} = 1 \div 10 = 0.1000$. The twenty thousand sampled pairs gave 0.1004.
At $d = 1000$ the rule predicts $1 \div \sqrt{1000} \approx 0.0316$. The samples gave 0.0315.
At $d = 10$: predicted $1 \div \sqrt{10} \approx 0.3162$, measured 0.3176. At $d = 2$: predicted $1 \div \sqrt{2} \approx 0.7071$, measured 0.7055.
In words: four predictions and four matches, every one of them inside half a percent, from a rule you can do in your head. This is not a rough trend — it is a law of these spaces, and it is the single most useful number to carry around about a model's embedding size.
Almost everything is skin
The angle result has a companion, and it is the one that most offends a flat-page intuition.
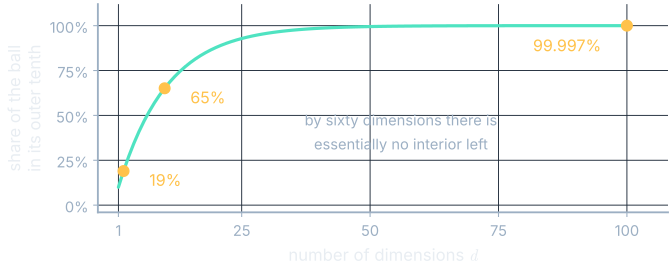
Take a ball of radius 1 — in two dimensions that is a disc, in three a solid sphere, in a thousand something we cannot draw but can certainly measure. Now ask: what fraction of it lies in the thin outer rind, the part between radius 0.9 and the surface?
The answer is arithmetic you can do on paper. Volume scales with the $d$-th power of the radius, so the inner ball of radius 0.9 holds a fraction $0.9^d$ of the whole, and the rind is whatever is left over.
$$\text{fraction in the outer rind} = 1 - 0.9^{\,d}$$In words: raise nine tenths to the power of the number of dimensions to find how much of the ball is in the inner core, and subtract that from 1 to find how much is in the outer tenth of the radius.
The rind, by hand
On a page, $d = 2$: the core is $0.9^2 = 0.81$, so the rind holds $1 - 0.81 = 0.19$ — about a fifth. That matches what your eye expects from a dartboard.
At $d = 10$: the core is $0.9^{10} \approx 0.349$, so the rind holds about 65%. Already most of it.
At $d = 100$: the core is $0.9^{100} \approx 0.0000266$, so the rind holds 99.997%.
At $d = 1000$ the core is smaller than one part in $10^{45}$, a number with no useful name.
In words: in the spaces models actually use, a ball is all surface. If you pick a point inside one at random, it is sitting on the skin, and so is every other point you will ever pick.
Put that beside the angle result and you have the true picture of a high-dimensional space: everything lives on a thin shell, and everything on that shell is at right angles to everything else. It is nothing like the inside of a room. It is much stranger, and much more useful.
Nearest is barely nearer
One more measurement, and this one has teeth, because entire products are built on the assumption it violates.
Scatter a thousand points at random. Stand at a new random point and ask for the closest one and the farthest one. On a page, that is a meaningful question — the closest point is practically underfoot and the farthest is across the room. Now do it in more dimensions.
| Dimensions $d$ | Distance to nearest | Distance to farthest | How much farther the farthest is |
|---|---|---|---|
| 2 | 0.016 | 1.033 | 115× as far |
| 10 | 0.499 | 1.912 | 2.9× as far |
| 100 | 3.326 | 4.772 | 0.44× as far |
| 1000 | 12.191 | 13.630 | 0.12× as far |
Read the last column again. On a page, the farthest point is more than a hundred times farther away than the nearest one, and "nearest" is a strong, obvious, robust answer. At 1000 dimensions the farthest point is only 12% farther than the nearest. Every one of the thousand points is at roughly the same distance from you, and "the nearest" is a photo finish decided in the third decimal place.
See it move
Do not take the table on trust. The widget below runs the experiment live in your browser — it draws fresh random directions, measures the angles, and builds the histogram in front of you. Move the dimension slider and watch the shape collapse.
Why this is good news
Everything so far has read like a list of things that go wrong. It is the opposite. Near-orthogonality is the property that makes an embedding space useful, and here is the argument in full.
Suppose you want a space to hold a direction for every distinct idea a model might need — "formal," "in French," "is a place name," "is talking about grief." If directions had to be exactly at right angles to avoid interfering, a space with $d$ dimensions could hold exactly $d$ of them, and 1024 ideas is nowhere near enough for a language.
But they do not have to be exact. They only have to be far enough apart that reading one does not accidentally pick up much of another — and we now know what "far enough" costs. In 1000 dimensions, two directions picked at random are within about two degrees of square, so a reading taken along one of them picks up a leak of about 0.03 from the other. That leak is small enough to ignore, and it stays small for an enormous number of directions. Not 1000 of them. Millions.
So the honest summary of high-dimensional space is not "your intuition fails." It is this: the space is enormous, almost all of it is at right angles to almost all the rest, and that is precisely the room a model needs to keep a world's worth of distinctions from trampling one another.
Where this shows up
- Choosing an embedding size. The 1-over-the-square-root-of-$d$ rule tells you what a similarity score is worth before you have run a single query. It is why moving from 384 to 1536 dimensions changes what a threshold of 0.3 means.
- Setting a similarity threshold. Any fixed cutoff — for deduplication, for "is this relevant enough to retrieve," for "has this person's style changed" — is a statement about how many standard deviations of noise you are willing to accept. Compute the noise floor first.
- Approximate search. Index structures that trade exactness for speed are living on the photo-finish result. RAG and Vector Search shows the machinery; this chapter explains why the approximation is affordable.
- Reading interpretability work. Steering vectors, linear probes, sparse feature dictionaries — all of them assume you can find many nearly-independent directions in one space. That assumption is the measurement we just made.
Which leaves one problem. If almost nothing is visible in two dimensions, what exactly are we looking at when somebody shows us a two-dimensional plot of an embedding space?
What you now know
- Two directions drawn at random in a high-dimensional space are almost always close to a right angle, and the tightness of that result grows with the number of dimensions.
- The spread of the alignment score between unrelated directions is about 1 divided by the square root of the dimension count, which four separate measurements confirmed to three decimal places.
- A similarity score cannot be interpreted without knowing the dimension count, because the same number is noise in a small space and a strong signal in a large one.
- Almost all of a high-dimensional ball's volume lies in a thin shell at its surface, so there is effectively no interior to occupy.
- Nearest and farthest neighbors sit at nearly the same distance in high dimensions, which is why approximate search is affordable and why small model improvements are visible.
- All of this is what lets a space of 1024 numbers carry millions of distinguishable directions, which is the mechanism behind superposition.
Where we're headed
We have just established that the interesting structure lives in hundreds of dimensions and that a flat page cannot hold it. And yet every paper, every blog post and every dashboard shows embeddings as a two-dimensional scatter plot. Those pictures are shadows, and a shadow is a real measurement with real rules about what it can and cannot prove. The last chapter of this part is about choosing the flashlight angle on purpose, and about reading everybody else's shadows honestly.