The problem
Why does a satellite picture need a learned color recipe? A display wants a red, green, and blue value at every location. Our input stack supplies red and blue reflectance plus a near-infrared vegetation band, and no green. We’ll learn one mapping from measured bands to a visible picture, with the dense layers and held-out evaluation you already know.
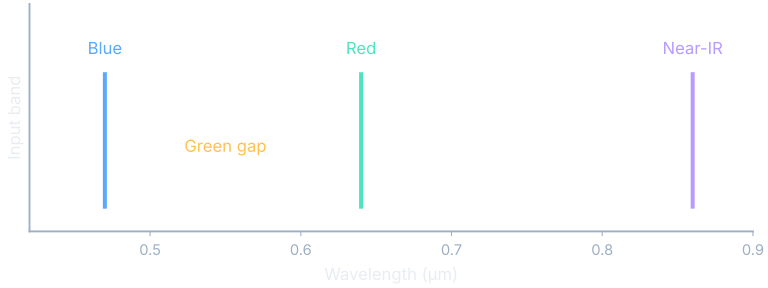
True color means a rendering meant to resemble human color vision. Synthetic green supplies the missing display value from the other bands. A fixed recipe always runs its prescribed calculation; a learned recipe adjusts weights against reference images. What matters is whether those adjustments help on a day the model never saw.
The data
A coincident pair matches the geostationary input with a nearby polar-satellite observation. The targets are corrected-reflectance true-color products from NASA GIBS. The match matters because a moving cloud can put a correct color prediction at odds with a reference that saw different weather. Source §1.
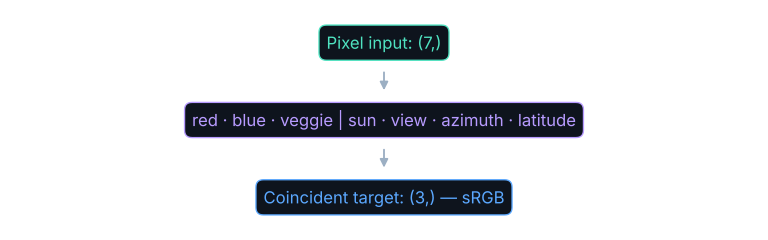
The input holds red, blue, and near-infrared reflectance, sun zenith, view zenith, relative azimuth, and latitude. Its fixed normalization divisors are [1.5, 1.5, 1.5, 90, 90, 180, 90]. Output values lie in [0, 1]. Geometry is in the feature list because illumination and viewing conditions change how a surface looks. Source §1.
The model
The model applies the same dense network independently at every pixel. That is a hard architectural restriction: it responds to the feature list and can’t look at a neighboring coastline or cloud edge. Read the arrows as array operations, with the dense-network chapter behind the weighted sums.
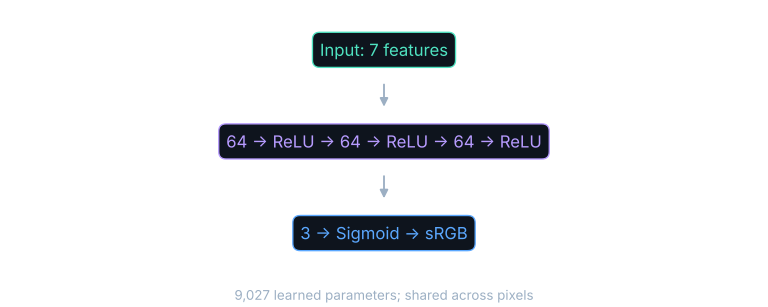
A hidden activation changes which combinations reach the next layer. The final squash keeps display values inside the allowed range. Neither adds spatial context. Feed the same feature list at another location and you get the same output; any location-specific difference has to arrive through an input feature. So judge this network as a color mapper, not an image-restoration system.
Where this comes from
The architecture is not novel: shared dense layers provide the learned mapping. Synthetic green follows CIMSS/NOAA’s recipe described by Bah et al. (2018) and JMA’s color reproduction in Murata et al. (2018); Broomhall et al. (2019) address vivid-color correction. We found one precedent for learned reconstruction compared with a polar-orbiter reference: Gonzalez and Yamamoto (2020), validated against MODIS. Ours is the matched corpus and per-pixel correction fitted against those reference colors, not an invention of synthetic green. Source §6.
The loss and why that loss
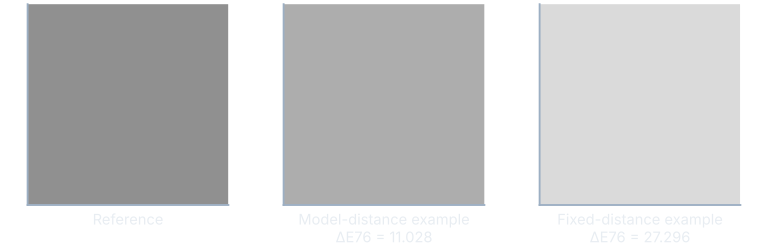
CIE Lab places colors in coordinates where distance roughly follows visible difference. ΔE is read “delta E”; here ΔE76 is the straight-line Lab distance. For coordinate differences dL, da, and db, $\Delta E76=\sqrt{dL^2+da^2+db^2}$: zero means identical colors, and distance has no universal upper bound. Roughly one unit is a barely visible reference, not a universal perceptual threshold. The model’s 11.028 versus the fixed formula’s 27.296 means about eleven rather than twenty-seven Lab units from the reference on average. Neither is a count of incorrect pixels. We did not measure a confidence interval; the gap is large, but we don’t know how much it would move on other days. The older distance formula over-weights saturated colors; we also inspect matched scenes and error maps. Source §1.
Worked example
For illustrative Lab triples (6, 2, 1) and (6, 5, 5), the coordinate differences are (0, 3, 4). The distance is $\sqrt{0^2+3^2+4^2}=\sqrt{25}=5$. The loss instead averages the squares: $(0+9+16)/3=25/3$. Distance and mean squared coordinate error share geometry but have different units. Source §7.
In words: convert the predicted color, y-hat, and target color, y, to Lab, square their coordinate differences, and average them.
This is the error measure from How Wrong Is It? with a color conversion in front. Differentiability lets the gradient pass through that conversion to the network. The loss rewards agreement with the matched reference; it does not directly reward dramatic saturation or a viewer’s taste. Source §1.
Training as it ran
The Himawari run used batches of 8,192 pixels, Adam with a constant learning rate of 0.001, and 30 epochs. The run took 0.31 hours from start to finish; each training epoch took about 0.2 minutes of that. Source §1.
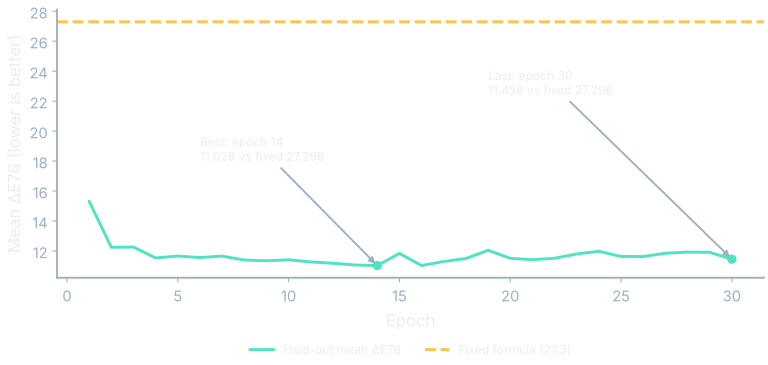
The best held-out mean error is 11.028 at epoch 14, against 27.296 for the fixed formula on the same pixels. The final epoch, 30, is a little worse at 11.458 versus the same fixed-formula 27.296. The fixed schedule had no early stopping, so we keep the earlier checkpoint instead of calling the final state best. That is an aggregate improvement, not an improvement at every pixel. A difficult surface can get worse while the mean falls. Source §1.
Outputs
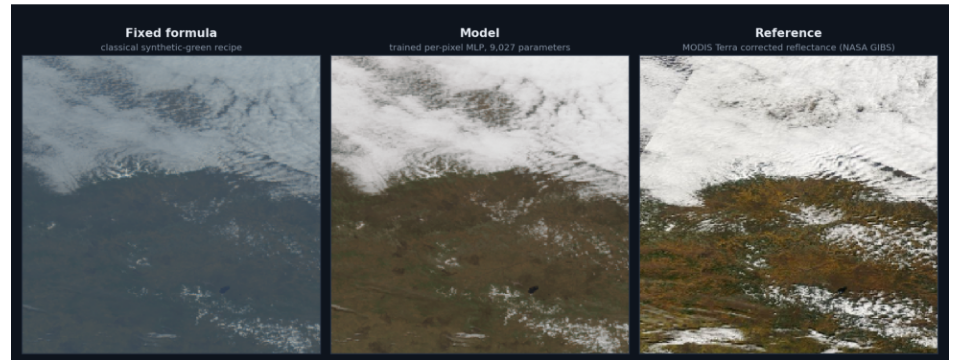
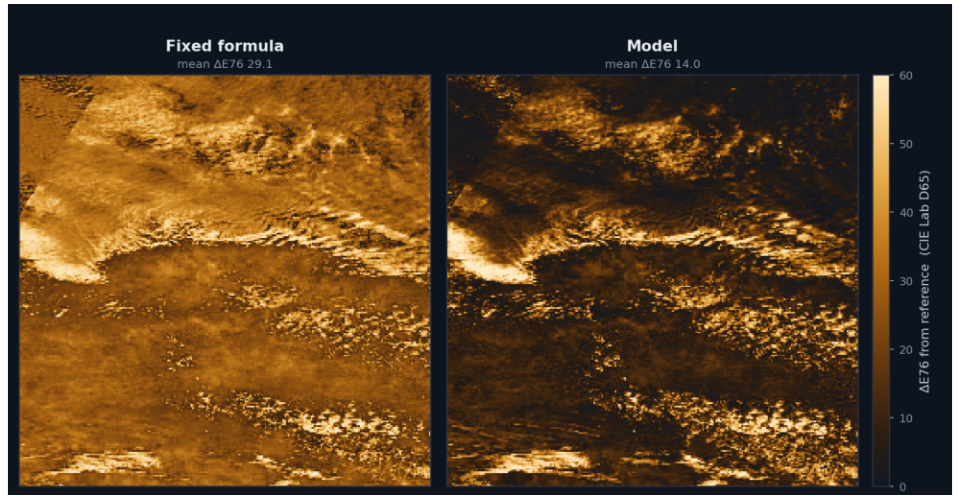
This comparison restores the original spatial planes, so neighboring pixels are geographic neighbors. The reference resolves finer detail than Himawari, and edge differences include sensor resolution and alignment. This scene’s model mean is 13.98 against fixed 29.09, which is not the run-wide 11.028 against 27.296. Neither comparison has a day-block confidence interval. Source §7.
Keep a probe identity fixed and scrub the epochs. The score below the image belongs to the whole held-out evaluation, not to the pixels visible in that probe. The training probe is a shuffled pixel atlas, a different thing from the spatial scene above. Holding the input identity fixed is what makes changes across checkpoints readable.
The color mixer is a browser surrogate fitted to copied model predictions. It leaves geometry out and is far smaller than the production network on purpose. Its fixed swatch evaluates the production formula at the slider inputs with sun angle held constant. Treat it as a demonstration of a learned mapping, not as production satellite processing.
What it is not
Training sun zenith spans 12°–79°, with a cap at 85°. These results say nothing about night. Source §1.
Where this shows up when you train
Keep the task you optimized apart from the task people will assume it does. A working color mapper is a useful result by itself. Calling it a scene corrector would bury the biggest limitation of its input representation. Keep the split, the baseline, and the pixel-selection rule beside the result.
Run this yourself
trainkit color samples/color.csv --output color-outputThe command writes run.json and model.json. Add --dry-run to preview the replacement targets. Keep your output away from the bundled book artifacts. The run records the data shapes, split, objective, baseline, model score, and elapsed time; the model export holds the learned weights themselves.
Worked example
The synthetic run ends with a normalized Lab MSE of 0.000343, against 0.00627 for the baseline, after about 56 seconds of training. Source §6.
The model-to-baseline error ratio is $0.000343/0.00627\approx 0.055$: about 5.5 percent of the baseline error. These coordinates are Lab divided by 100, not production ΔE76. We ran it once, so there is no interval on that ratio. Source §6.
Repeat the run before you change the recipe. Then change one input or model choice and compare on the same held-out examples. A different random split moves a score even when the learning rule is untouched. Keeping the original baseline is what separates an improvement in the learner from an easier evaluation problem.
What you now know
- The fixed recipe estimates green; the pixel network learns a color mapping from bands and geometry.
- Lab distance measures color agreement, not cloud alignment or missing detail.
- The selected checkpoint improves mean error over the fixed formula on the held-out day; uncertainty across new days remains unmeasured.
- A real scene preserves geography, while shuffled pixel probes show only color samples.
Where we’re headed
The same questions carry into the super-resolution chapter.